home | Booster Warnings by Month | Moderna | Pfizer | Janssen | Moderna (outside USA) | Pfizer (outside USA) | Janssen (outside USA) | International Deadly Lots | 1st & 2nd Doses | Severe | Lethal | Size Matters | Lot Sizes | Time till onset | Wave Modulation | Lot Expiry Dates | RNA Degradation | Causality | All or Nothing | Clusters | Symptom | Paralysis | Children | Gender | States | Geography | Japan | Case Reports | Whistle Blowers | EMA Leaks | Video Library | Treatment | Background | Download Source Code | Data Cleaning | Donate
A Curious Wave Pattern
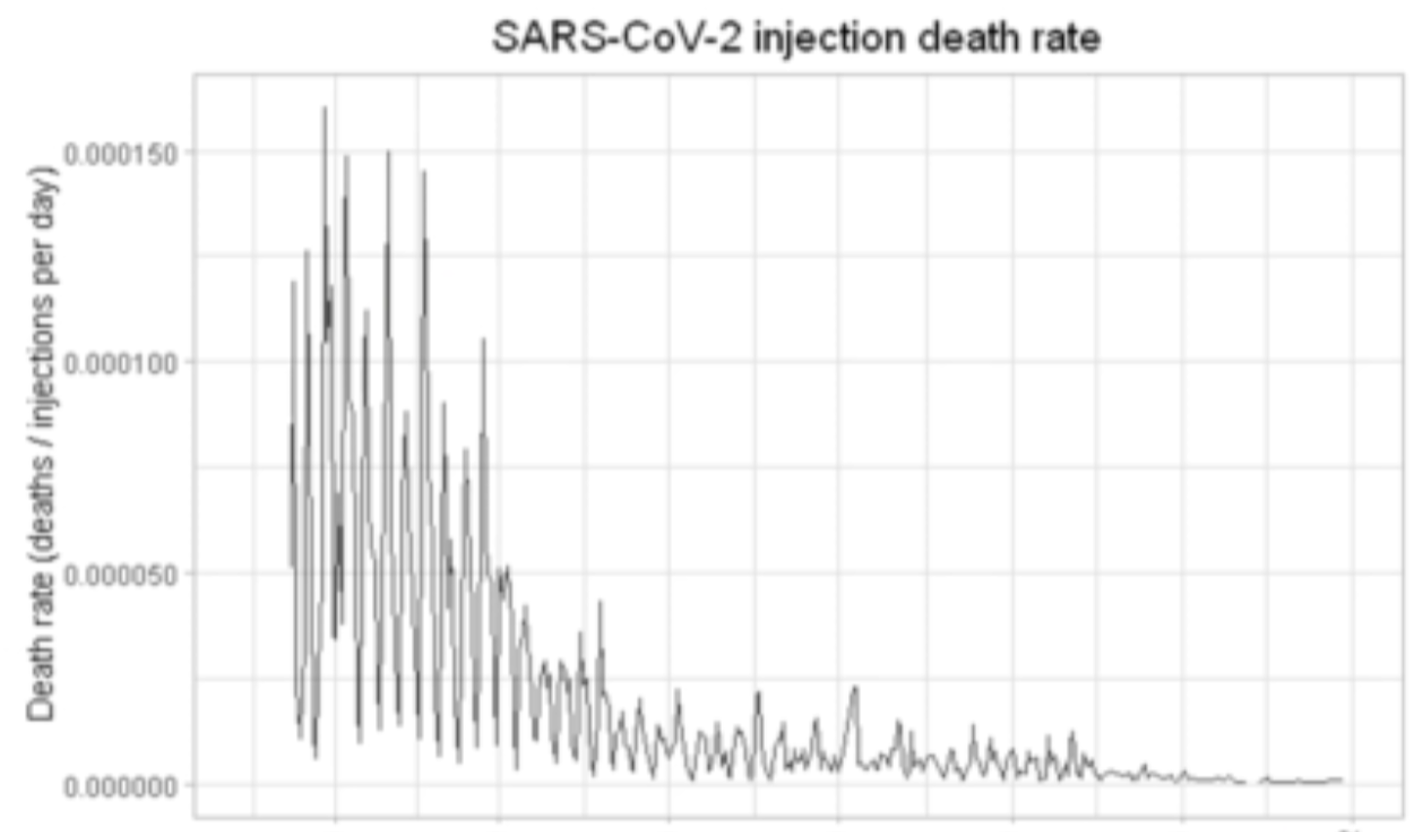
Here is a graph showing number of deaths for each day of 2021, divided by the number of people known to have been vaccinated on that day.
The date on the x-axis is the date of vaccination. The y-axis shows the total number of deaths on that date, divided by the total number of vaccinated on that date.
The graph shows that the initial vaccines had the highest lethality, causing the greatest number of deaths per number vaccinated.
What is more curious though, is the way these early vaccines varied. There is a wide variation between a uniform base line and the surrounding peaks. Were the vaccines delivered on some days placebos? Why does the vaccine lethality jump up to a high peak, then DOWN TO THE SAME BASE LEVEL?
Another really, really odd thing about this occilation is that it takes place every 7.5 days, EXACTLY- so there are 8 cycles in every two month period. Each peak is followed by progressive decrease over the next 3.75 days until a trough is reached - then this trough is followed by progressive increase in lethality over the next 3.75 days until a peak is reached. This pattern continues to repeat for 9 months - from January till September.
What can account for this pattern of occilation? What can possibly be modulated to give rise to such a wave pattern? What we are looking at is a sine wave. It remains the same in frequency, yet its amplitude decreases progressively over the whole of 2021
I am not sure what could give rise to this pattern, so I am inviting readers to contribute ideas. Ofcourse, the cause of this modulation in deaths would have to be varied precisely in amplitude in a repeating cycle for this pattern to arise. My first guess is that the deaths are being triggered by some kind of signal, with the number of deaths varying with the strength of the signal
I apologise for the roughness of the graph. This is just a draft, and will be investigated and edited very rapidly over the next few days. But I just wanted to publish it immediately, since its implications are too great, and my life is less certain than it used to be.
Donate
Please consider making a donation in support of ongoing research support. Donate
Contact
covidscienceteam@protonmail.com
Created by Craig Paardekooper ©2021